
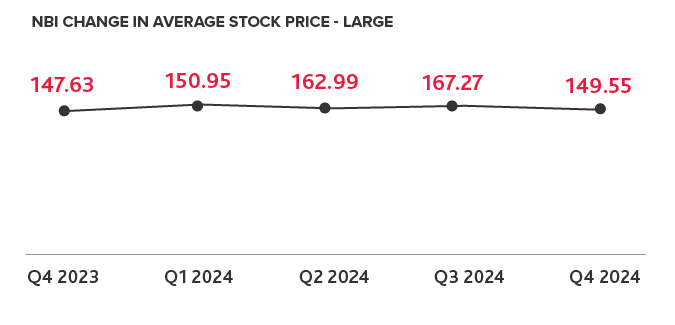
NASDAQ Biotech Index Sees Growth in 2024
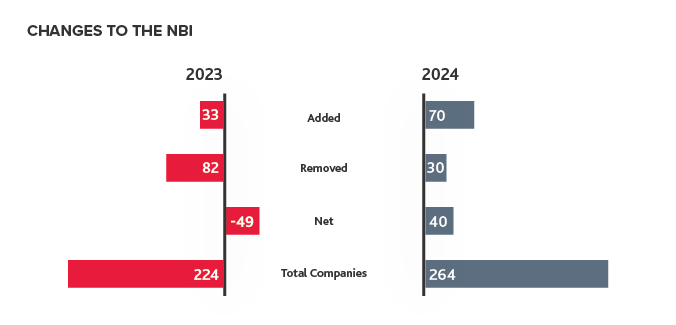
Last year, 70 companies were added to the NBI — more than doubling the 33 added in 2023. With only 30 companies removed in 2024, the NBI saw a net positive change of 40 companies. This increase of companies on the NBI illustrates that more biotech companies are meeting the market capitalization requirements to join the index, indicating the industry was recovering at the end of 2024.
However, market volatility has materialized in 2025, with markets fluctuating due to unclear tariff policy. In addition, cuts to government healthcare agencies, as well as new agency leadership with different health research priorities is further contributing to uncertainty within the biotech industry. Uncertainty and market turmoil could lead to less private capital fundraising in 2025. Some biotechs may not have the funding to advance their products in development to clinical trials and beyond, which could result in a smaller number of companies on the NBI by the end of the year.
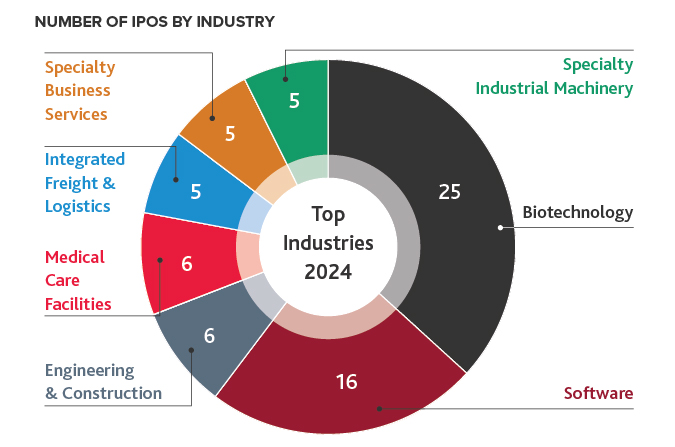
Biotech Leads the IPO Charts
Biotech was the top industry to IPO in 2024, with 25 IPOs. Of those 25 new IPOs, seven were added to the NBI. Six more biotechs went public in 2024 compared to 2023. Overall, there were 68 IPOs in 2024. Other industry leaders include software, engineering and construction, and medical care facilities.
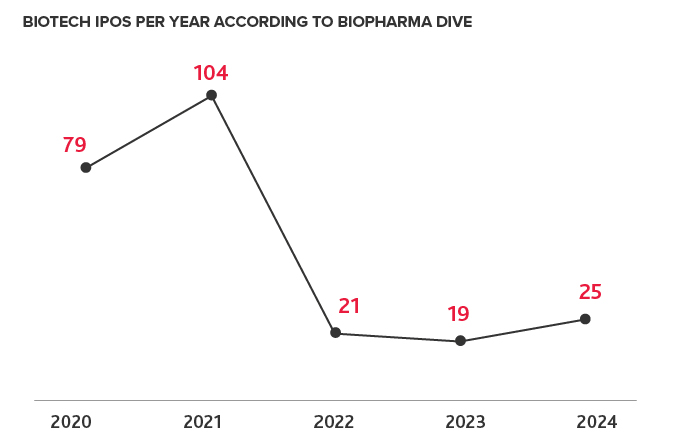
Biotech IPOs have not fully rebounded since 2021, and while there are some signs of optimism, obstacles may slow the pace of them in 2025. Factors such as ongoing inflation, supply chain challenges, tariffs and economic uncertainty, and a slower pace of fundraising have made it more difficult for biotech IPOs to rebound. Additionally, with an unusual bifurcation in the VC landscape between large funding rounds, or no funding at all, some private companies have experienced difficulties going public in the past year.
Potential economic and political disruption could slow IPO plans in 2025. Biotech companies may consider alternatives to an IPO. Silicon Valley Bank’s 2024 report on Healthcare Venture Capital Investments and Exits demonstrates more biotechs may be turning to M&A and other strategic transactions in lieu of the public markets, saying, “Public performance remains a challenge for biopharma. The difficulties of public biopharmas are reflected in IPO market cap numbers, where private M&A spend is outpacing IPO totals for the first time we’ve tracked.”
Some companies are exploring special purpose acquisition company (SPAC) deals, reverse mergers, or private investment through venture capital or private equity. Private equity (PE) is beginning to take a unique approach to its investments in biotech. PE funds are moving away from the traditional ownership model and instead looking to provide debt financing to biotechs and provide private investment in public entities (PIPE).
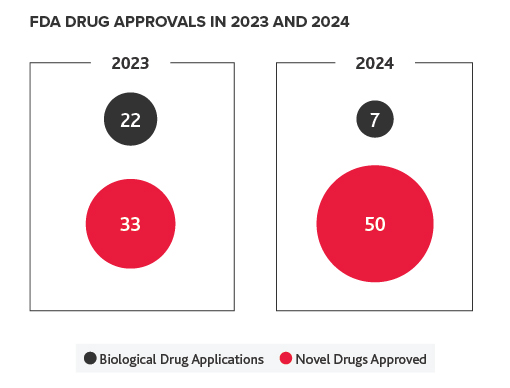
FDA Approvals Remain Steady in 2024
2024 saw 50 novel drug approvals and seven biological applications. In comparison, there were 33 novel drug approvals and 22 biological applications in 2023.
Of the novel drug approvals in 2024, the top therapeutics approved were oncology/ cancer treatments, hematology, and cardiovascular. Oncology was a priority of the Biden administration, but the focus of the Trump administration remains unclear. Cuts to federal research grants may slow early-stage development in oncology and other disease areas.
In addition, cuts in staff could delay overall approvals in 2025. For example, there is some concern that the Food and Drug Administration (FDA) is failing to meet Prescription Drug User Fee Act (PDUFA) and Medical Device User Fee and Modernization Act (MDUFA) dates by which they are required to make an approval decision. If this reauthorization is delayed, the FDA may lose annual user fee revenues that fund prescription drug reviews and other associated regulatory activities.
This may be caused by staffing cuts at the FDA. If this develops into a trend, it will be more challenging for biotechs and investors to make decisions on when to IPO, given uncertainty with FDA approval timing.
| FDA Approvals in 2024 By Therapeutic Type | |
|---|---|
Oncology/cancer | 16 |
| Hematology | 9 |
| Cardiovascular | 6 |
| Dermatology | 7 |
| Rare Disease | 3 |
| Hepatology/liver | 3 |
| Neurology | 3 |
| Urology | 3 |
| Respiratory | 3 |
| Psychiatry | 1 |
| Endocrinology | 2 |
| Infectious Disease | 1 |
*Some approvals span multiple types of disease areas and are counted more than once.
After approving six cell and gene therapies in 2023, the FDA continued its momentum on cell and gene therapy in 2024, approving seven therapies. While there’s been success, the cell and gene therapy sector continues to face challenges, including the high cost of goods, efficacy challenges, limited patient populations, and complex treatment regimens. Gene therapy in particular faces challenges with adoption and launching products into the market, which could dissuade future investors.
In addition, the new administration may shift priorities, and an unpredictable economic landscape could slow development in 2025. The current administration has already stated its plans to deprioritize infectious disease research, and recent cuts to federal health research grants could delay early-stage research.
While it remains to be seen if the new administration’s priorities will affect the pace of drug approvals at the FDA, slower early-stage research may hinder investor interest in biotech companies.
To maintain industry research momentum life sciences companies should consider diversifying funding sources, staying informed on federal priorities, and enhancing regulatory compliance and risk mitigation. Learn more in our insight: Best Practices for Biodefense and Life Sciences Contractors Amid Federal Funding Uncertainty.