BDO Biotech Brief - Summer 2022
After The Biotech Boom
This edition of BDO’s Biotech Brief examines the most recent 10-K SEC filings of companies listed on the NASDAQ Biotechnology Index, which includes organizations classified as biotechnology or pharmaceutical companies according to the Industry Classification Benchmark, that also have a market capitalization of at least $200 million. BDO used CalcBench to conduct this data analysis.
Table of Contents
Biotech in 2022: Key Findings
Revenue Increased Sharply in 2021 & Profits Are Up On Average
Valuation Gains from 2020 Have Been Erased
R&D Spending Continues to Increase, But Slows from 2020
Debt and Equity Issued Now Will Provide A Cushion In A Cooling Market
Implications Of Cash and Debt On Deal Making
Manufacturing Capacity - Biotrak® Data
Biotech Regional Hubs
What's Ahead For Biotech
METHODOLOGY
This edition of BDO’s Biotech Brief examines the most recent 10-K SEC filings of companies listed on the NASDAQ Biotechnology Index, which includes organizations classified as biotechnology or pharmaceutical companies according to the Industry Classification Benchmark, that also have a market capitalization of at least $200 million. BDO used CalcBench to conduct this data analysis. This report defines large companies as those with over $1 billion in revenue. Medium companies have between $50 million and $1 billion in revenue and small companies have under $50 million in revenue. All chart data is in millions of U.S. dollars.
Key findings
Each year, BDO analyzes the most recent 10-K SEC filings of companies listed on the NASDAQ Biotechnology Index (NBI) to uncover important trends in the biotech industry. Our most recent analysis shows that the break-neck pace of 2020 is over, but the biotech industry remains resilient.
About the NBI
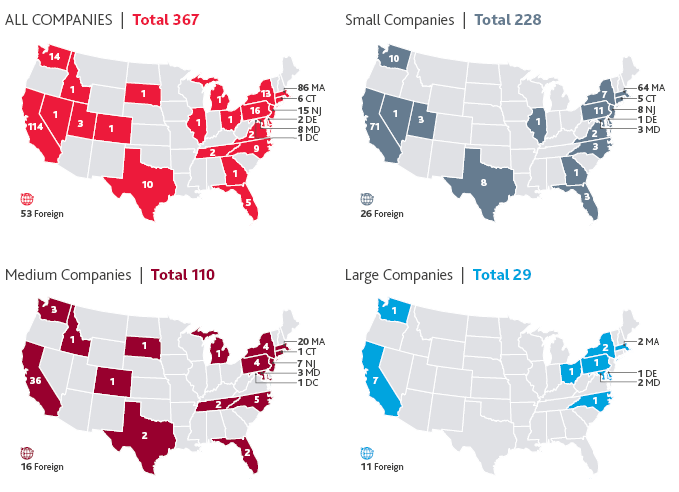
The NBI contains securities of NASDAQ-listed companies classified according to the Industry Classification Benchmark as either biotechnology or pharmaceuticals. The NASDAQ Biotechnology Index is calculated under a modified capitalization-weighted methodology. As of December, 2021, there are 367 companies on the NBI.
Here is the distribution of small, medium and large companies on the index:

For the purposes of this report, we are defining small, medium and large biotechs as:
Small: $0-$50 million in revenue. Medium: $50 million-$1 billion in revenue. Large: $1 billion+ revenue
All chart data is in millions of U.S. dollars and all charts refer to companies on the NBI.
Revenue increased sharply in 2021 & profits are up on average
In 2020 and 2021, Biotech companies raked in revenue. For companies on the NBI, revenue increased by 37% in 2021, compared to a 10% increase in 2020, making this one of the largest increases in years.
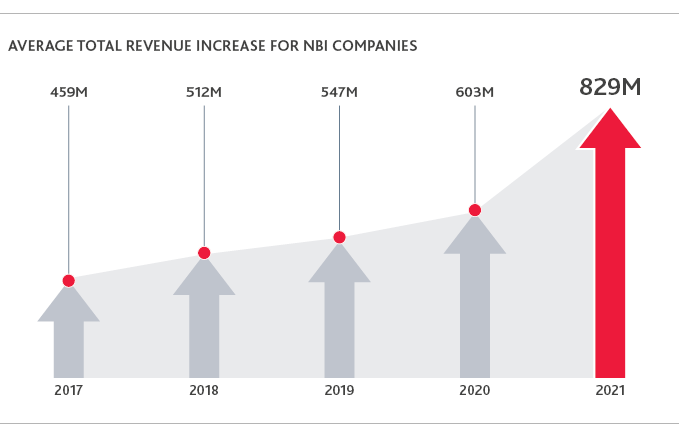
Part of this revenue was driven by COVID-19 vaccines and therapeutics. BioNTech’s revenue increased by almost $22 billion, Moderna’s revenue increased by almost $18 billion and AstraZeneca’s revenue increased by $10 billion.
In addition to this impressive growth, average profits for companies on the NBI are up.
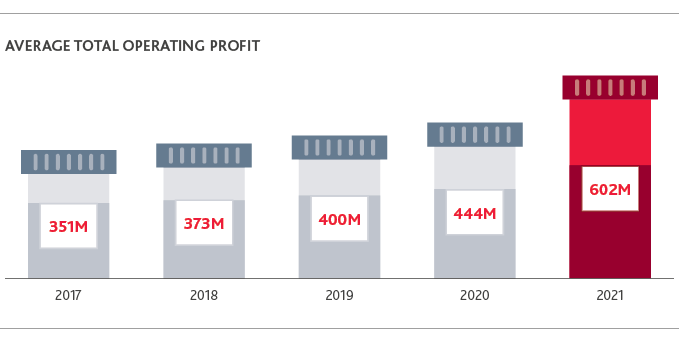
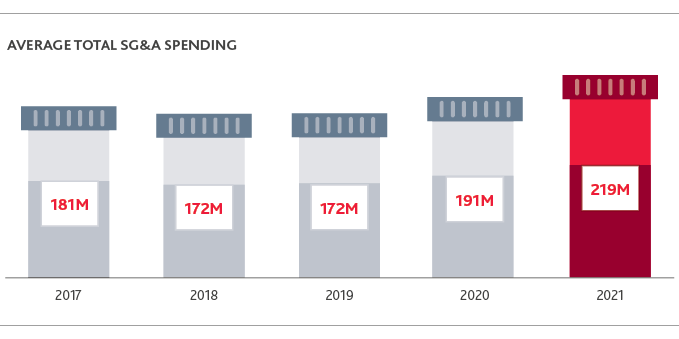
With profits up dramatically, biotech companies are pushing more of their cash to selling, general and administrative expenses (SG&A). The SG&A spending could help biotechs boost revenue for their current product offerings.
Valuation gains from 2020 have been erased
While the average valuation of biotechs on the NBI increased by 24% in 2020, valuations declined by 24% in 2021. The rally of 2020 is over as the stock market enters bear territory.
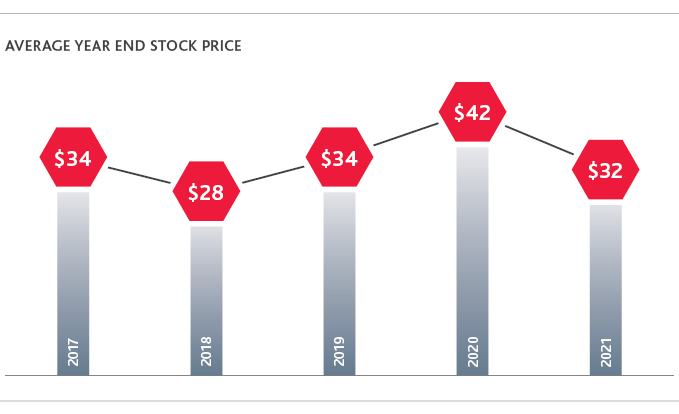
Additionally, repurchase of the common stock declined by 29% on average. Biotechs have come under criticism for buying back stock instead of investing in R&D, and this criticism was more pronounced during COVID-19. With high valuations for the first half of 2021, biotechs may not have seen the value in buying back their own stock. However, in 2022, BioNTech announced plans to do the same, to help bolster valuations. Available cash reserves may allow for more buybacks in 2022. However, shareholders and investors would likely rather see investments in R&D, acquisitions or partnership agreements to grow pipelines, rather than pursuing stock buybacks.
R&D spending continues to increase, but slows from 2020
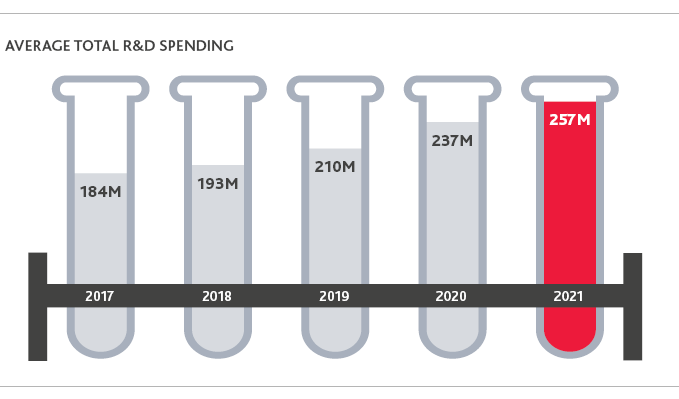
Biotechs continued to spend heavily on R&D in 2021
The year’s long trend of increasing R&D spending has paid off in the form of a revenue spike. But there is evidence the pace of R&D spending is starting to slow. R&D spending increased by 9% in 2021, compared to 13% in 2020, the largest increase in spending in the past five years.
Debt and equity issued now will provide a cushion in a cooling market
With low interest rates, biotechs loaded up on debt in 2020. But by 2021 proceeds from the issuance of debt decreased by 36% in 2021, down from a 174% increase in 2020.
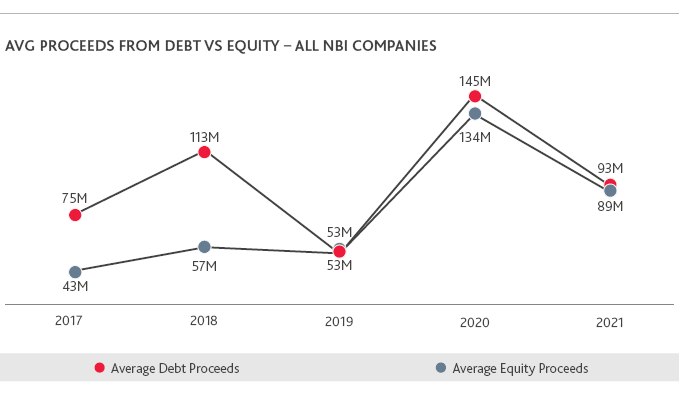
While interest rates remained low in 2021, biotechs were not in need of additional cash. Additionally, the anticipation that interest rates would soon rise likely led to less issuance of debt, compared to previous years.
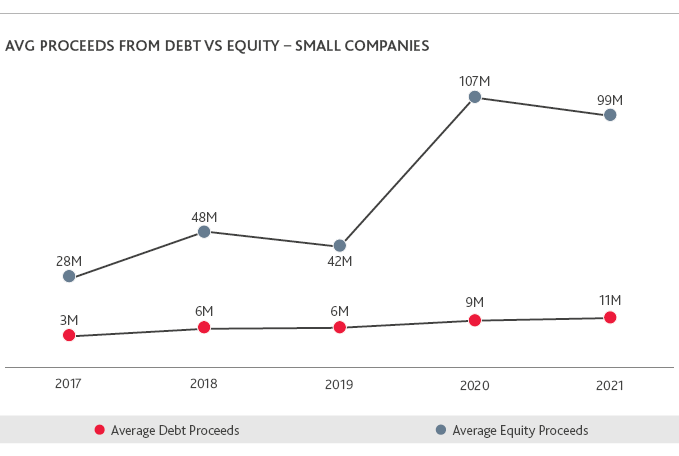
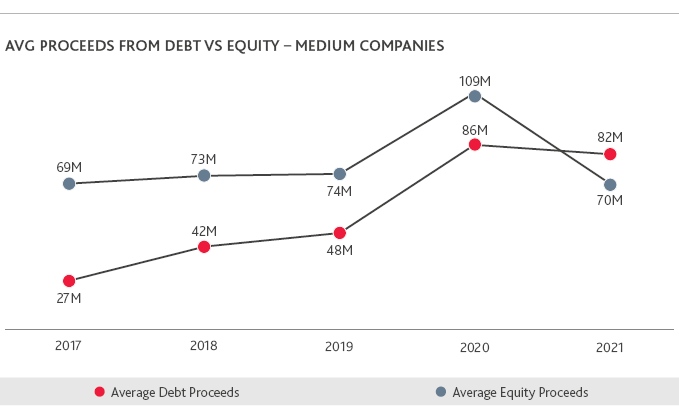
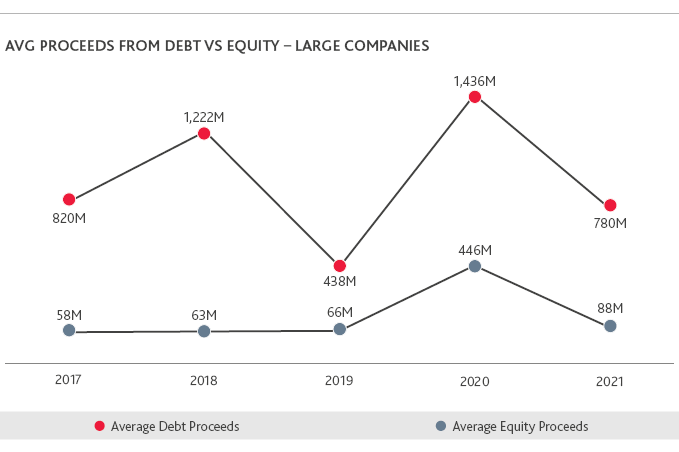
The debt that biotechs have taken on now will help provide cash as interest rates rise and funding from investors dries up. The relationship between debt/equity and R&D is one to watch. Smaller biotechs primarily finance R&D and clinical trials through equity, while larger companies primarily finance through debt, so as not to dilute shares.
A dip in equity could shrink the research and clinical trial budgets of small companies, forcing them to make hard decisions on which clinical trials to fund. Shrinking equity could push biotechs to look to partnerships or M&A as a source of investment. The decline in valuations and tightening of cash means big pharma is likely on the hunt for bargain buys.
Implications of cash and debt on deal making
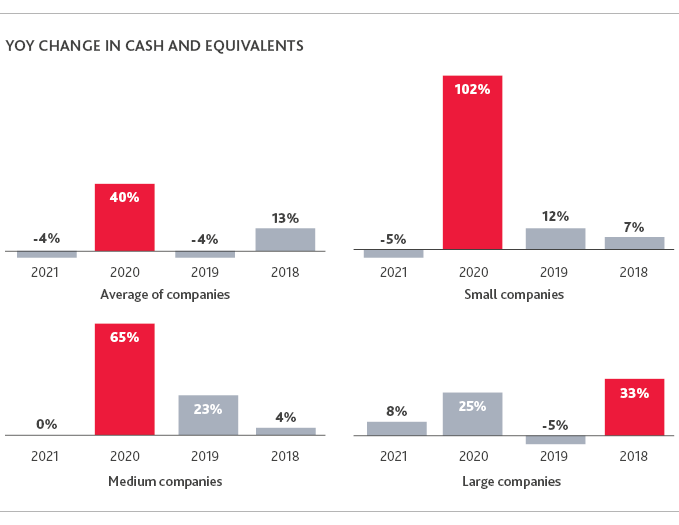
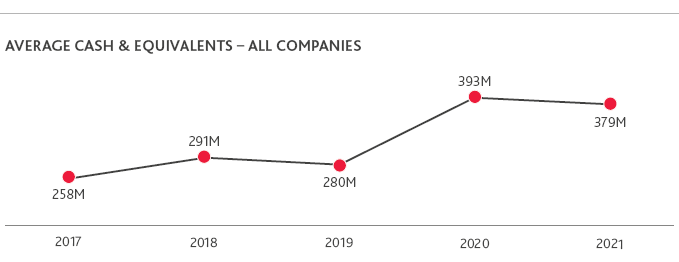
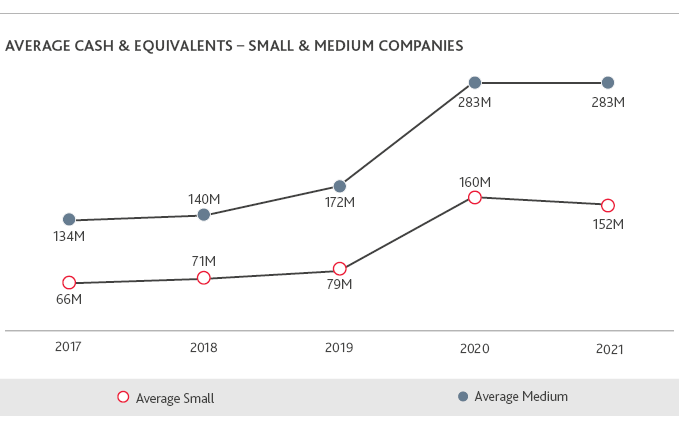
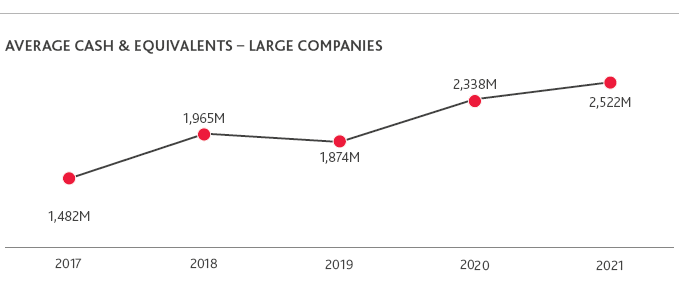
On average, cash and equivalents have decreased slightly, following a strong increase in 2020. Small companies saw cash and equivalents decrease while medium and large companies saw slight increases.
Manufacturing capacity – bioTRAK® data
The biopharmaceutical industry is growing and shows no signs of slowing.
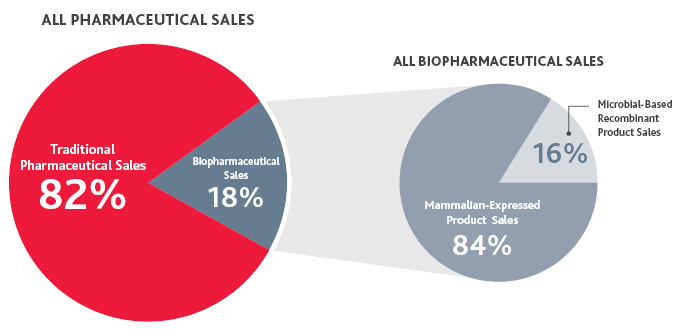
According to BDO’s bioTRAK® database, which tracks the demand and supply of biomanufacturing capacity, biopharmaceutical sales have grown 60% in the last five years, whereas traditional pharmaceutical sales have grown 22%.
Currently, biopharmaceutical sales represent 18% of the global pharmaceutical market. Primarily composed of two expression systems, mammalian and microbial, few biopharmaceuticals are manufactured in other expression systems (i.e., insect or plant cell culture).
As biopharmaceuticals continue to be discovered, developed and commercialized, the biopharmaceutical market continues to grow and we’re seeing supply and demand expand rapidly.
DEMAND CONTINUES TO GROW*
With an increasing pipeline of products expected to be commercialized by 2026, along with over 300 currently marketed biopharmaceuticals, demand for recombinant products (measured in kg) is projected to significantly increase for both mammalian and microbial-expressed recombinant products:

SUPPLY GROWTH PROJECTED AT 3-6%*
The supply of both recombinant mammalian and microbial capacity is projected to increase significantly over the next five years, with mammalian capacity growing twice as fast:

Most mammalian capacity (nearly 40%) is currently located in North America; however, by 2026, Europe’s capacity is projected to surpass North America’s due to significant planned expansions.
By contrast, most recombinant microbial capacity (60%) is currently located in Europe. North America is projected to increase capacity slightly by 2026 (from 31% to 35%) and Europe’s capacity is expected to decrease to 56% by 2026.
* Product sales, kg and volumetric demand for recombinant therapeutics specifically designed to treat SAR-CoV-2 infection (COVID-19) are not included within this dataset at this time. These recombinant therapeutics currently have a unique demand profile resulting in unique assumptions and require a modified forecast methodology.
Biotech regional hubs
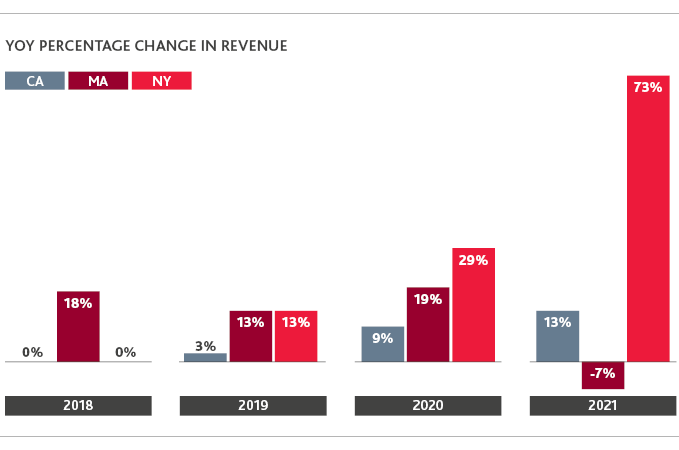
The biotechnology industry has long been concentrated in California and Massachusetts, with smaller hubs in select states on the West Coast and Northeast, such as New Jersey, Pennsylvania, New York and Washington. However, we are seeing biotech hubs emerge and expand in the south and southeast region in Texas, North Carolina and Maryland.
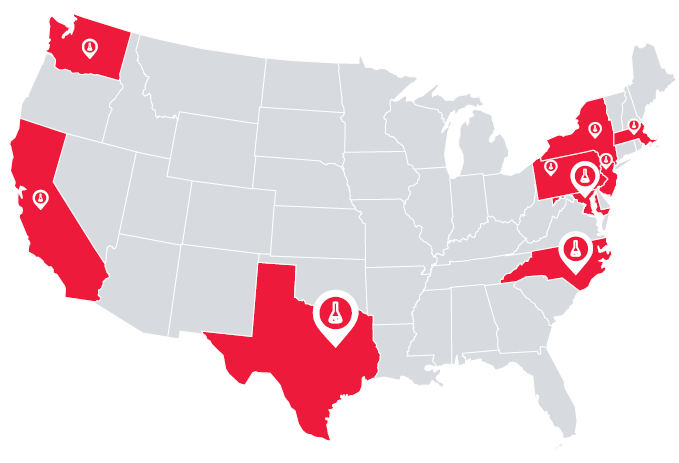
Number of biotechs on the NBI by state headquarters
The biotechnology industry is expanding beyond traditional locales to cities and states with an educated workforce, top research universities, relatively affordable real estate and a friendly business environment. Several states and cities have economic development boards that are dedicated to bringing more biotech companies to their regions, as the industry offers high paying jobs, tax revenue and other economic benefits.
What’s ahead for biotech
While the biotech boom of 2020 may have come to a close, financials indicate the industry will continue to prosper. While the pace of R&D spending has started to slow, this is likely temporary. Strong revenue will likely be pushed back into R&D.
Less funding coupled with selective investments from investors could actually promote biotech innovation, as investors will look to fund products with the greatest chance of success. Similarly, biotechs operating on a leaner budget could lead to streamlined pipelines focused on core research areas with the added bonus of gained cash for releasing non-core assets. Larger biotechs will likely pursue deals and partnerships where they see a promising product opportunity. No matter their size, less funding means biotechs will need to manage their cash carefully.
Given the recent lackluster IPO and SPAC performance in this space, as explored in the 2022 Life Sciences CFO Survey, the opportunity to sell their business has become more attractive for biotech startups. To entice buyers and secure an attractive price, they’ll need to start preparing for a sale sooner rather than later.
SHARE