
Flight to Quality Trend in Commercial Real Estate
Market participants in the commercial real estate sector have reported a nationwide "Flight to Quality" trend within the office market, as investors gravitate towards higher-grade properties. However, recent research conducted by BDO’s Valuation and Capital Market Analysis (VCMA) group presents a more nuanced picture. Our findings reveal that while this trend is indeed prevalent in Class A office spaces in markets such as New York and Chicago, it manifests differently in Los Angeles, where it varies on an asset-by-asset basis.
BDO’s analysis suggests that the "Flight to Quality" movement may have reached its zenith in cities like Dallas, San Francisco, and Seattle, and is now experiencing a decline. It is becoming increasingly clear that "Flight to Quality" is not a monolithic phenomenon but rather a complex and market-specific process, with each city — New York, Los Angeles, Chicago, San Francisco, Dallas, and Seattle — exhibiting unique patterns and stages within the trend's lifecycle.
Prepare to challenge your assumptions and gain key insights into the true state of quality migration in the office market. Read on to discover the real story behind the "Flight to Quality" in America's top cities.
Tenants Searching for Quality in New York and Chicago
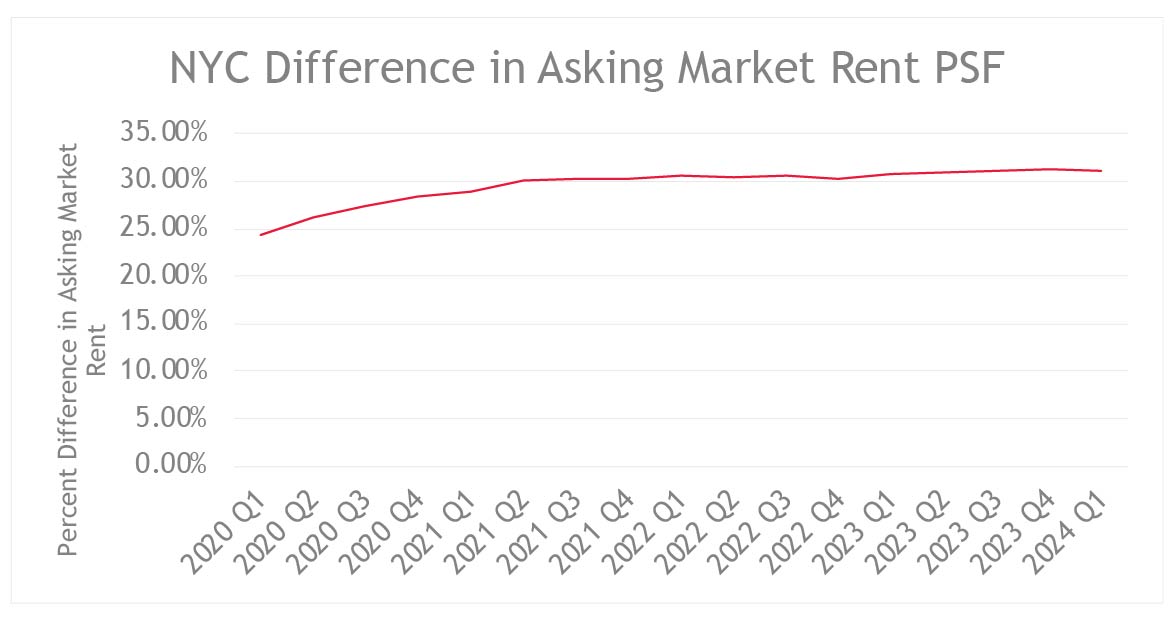
The BDO VCMA group analyzed the gap between market asking rents for Class A and combined Classes B/C properties. There are clear indications that “Flight to Quality” is only occurring in Chicago and New York City.
New York City has experienced a gap between the property classes of approximately 31%, which appears to have peaked in Q4 2023. In Q1 2024, the market exhibited a slight decline — by a fraction of a percentage point — but remains well above historical ranges. This has steadily risen since the start of COVID-19.
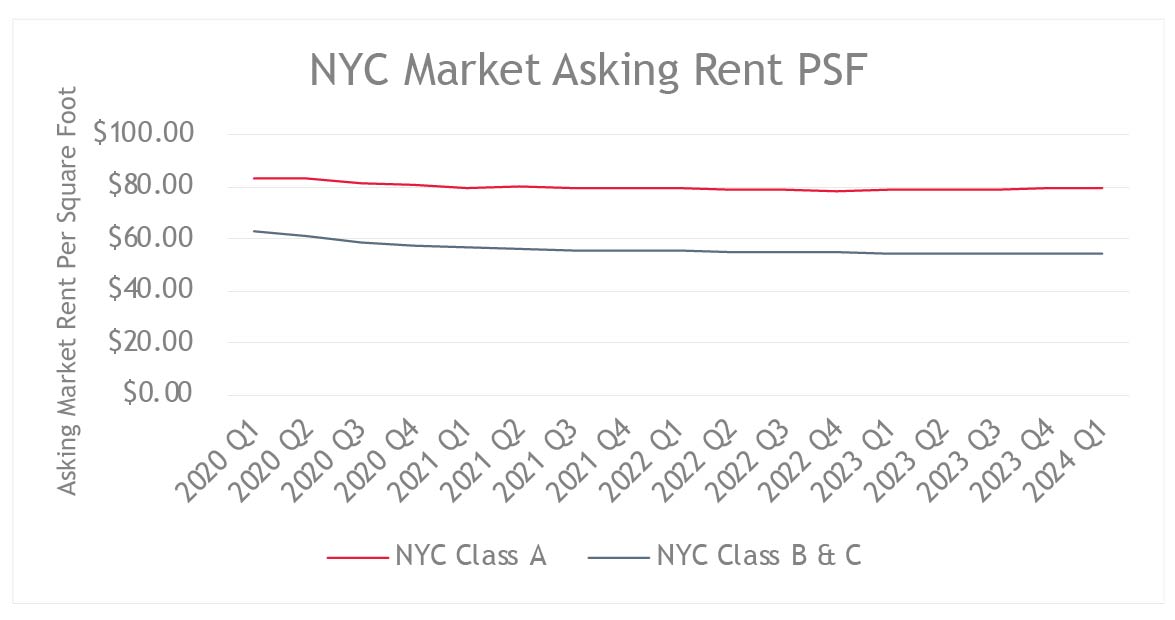
Conversations with market participants revealed consistent views on “Flight to Quality” in the New York City office market. Participants noted that Class A space in Midtown Manhattan could range from $75.00 to $120.00 per rentable square foot (RSF), with an increase in demand for brand-new ‘prebuilt’ space. Participants also noted that large capital expenditures on older buildings have been effective in attracting tenants. Classes B and C space, depending on the location and scope, could range from $35.00 to $50.00 per RSF with sublease space trading at a substantial discount to direct deals. Concessions remain high, with tenants able to obtain anywhere from six to twelve months’ free rent, with tenant improvement allowances ranging from $120.00 to $160.00 per square foot on a new direct, long-term basis. Because of limited availability in the high-end market (new construction/trophy class A+), the Class A market is becoming increasingly competitive. In New York City, driving factors for office tenants include good views, proximity to mass transit, amenities, and overall quality of the asset.
Leading third-party data provider backs up the sentiment of office brokers in the New York office market who remain bullish on Class A office space. While not every property can command premium rents, the lack of new office space in New York City is increasingly allowing for Class A office space to retain and expand its rental rates while other properties crater.
While Class A space generally performs well in New York City, commentary from brokers paints a completely different picture for Classes B and C office space. According to the brokers surveyed, Class A office space on average commands $70.00 to $75.00 per RSF, compared to $45.00 to $50.00 for Classes B and C space. Pointing to an example in Downtown Manhattan where market bifurcation can be observed, one broker spoke of the stark comparison between office classes. Recently constructed Class A trophy office space located in the heart of the financial district for example, regularly goes for $75.00 per RSF, but nearby office space that is classified as an older build remains on the market for lease at $35.00 per RSF.
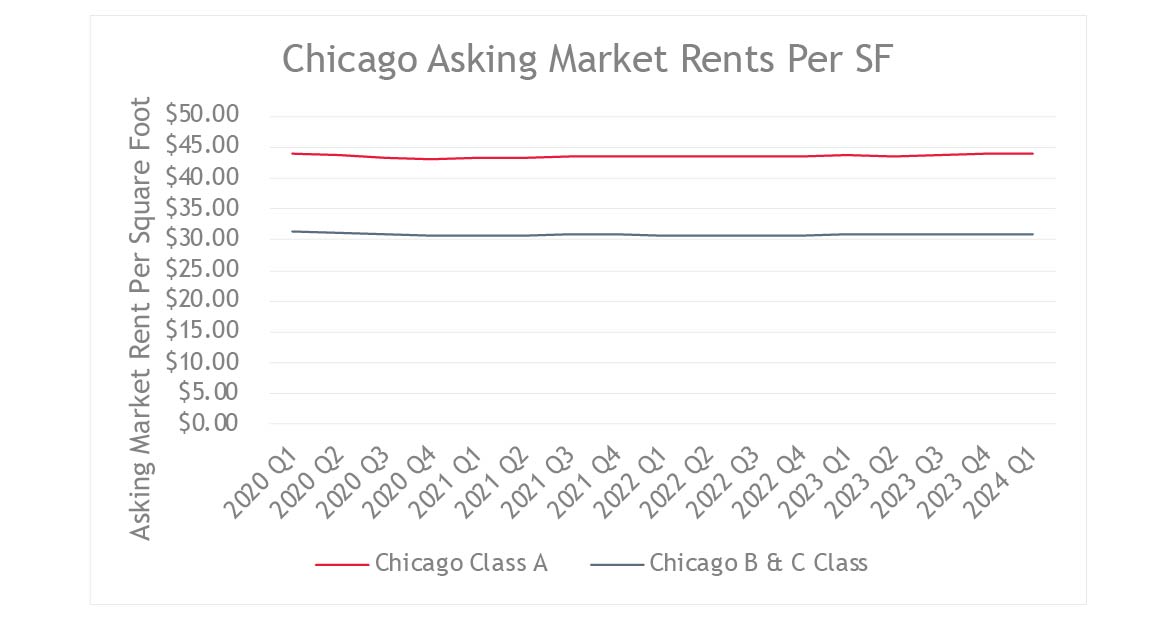
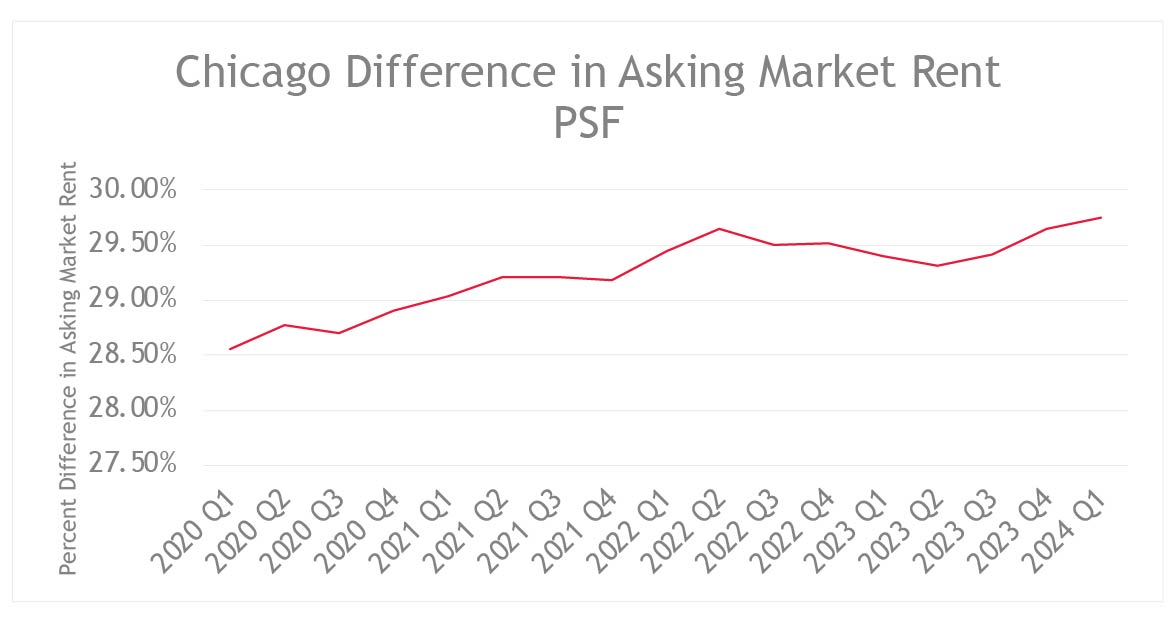
The Chicago office market is also bifurcating as tenants flock to Class A office space. The current gap between office classes is 29.74%, which, like New York City, has experienced less overall change since the beginning of the pandemic. While New York has seen a change of roughly 7%, Chicago has seen only 1%. This slight increase reflects general sentiment within the Chicago market that there is a “Flight to Quality” but not to the same extent as in New York City.
Some institutional tenants, such as banks, financial services, and law firms, appear to be more concerned with retaining and attracting talent than paying less on rent. These tenants are pursuing trophy office space, resulting in such properties — which are typically newer or have recently undergone major renovations — commanding higher rents. Quality tenants are looking for amenities, so Class A office buildings that haven’t tricked out their amenities may find it difficult to compete in the market. As noticed in other major cities, access to mass transit is also key for attracting tenants.
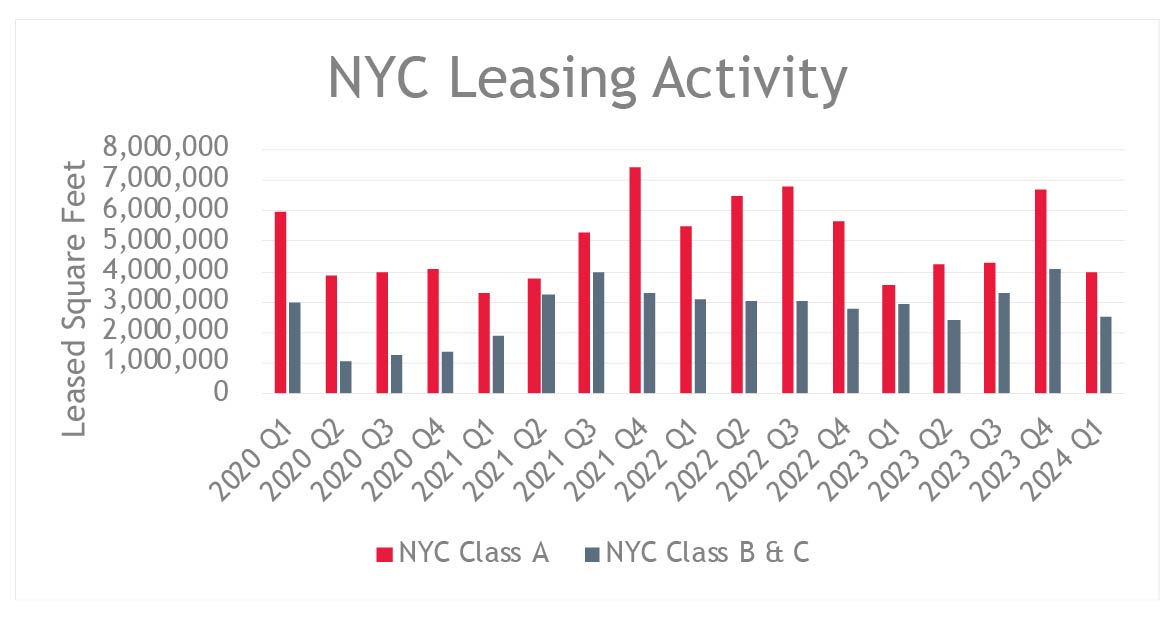
But this boom in trophy office space isn’t without its caveats. Commercial real estate brokers are seeing fewer deals, and those that do occur involve smaller spaces. Legacy buildings — those over twenty years lacking amenities or access to transportation — are struggling to compete in this market. In Chicago and New York, the presence of established, economically diversified, and price-insensitive tenants appears to be a key factor in enabling the “Flight to Quality.”
Tech Companies Still Set the Pace in San Francisco
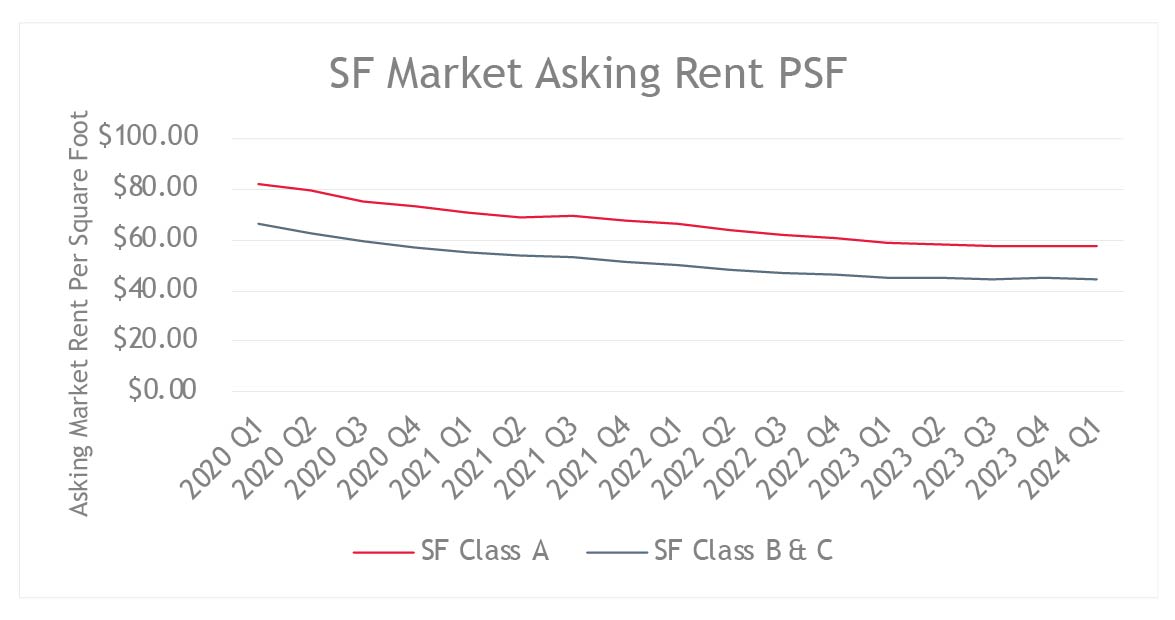
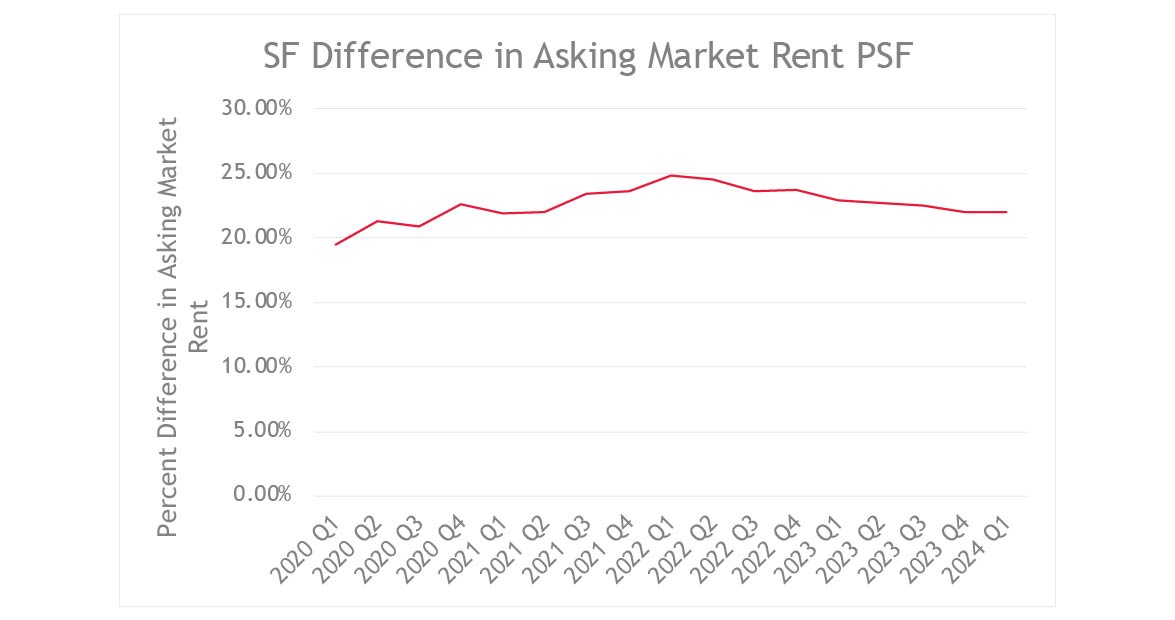
Unlike New York and Chicago, San Francisco is dominated by one industry: tech. The tech industry’s downturn earlier in 2023, combined with the widespread adoption of remote work and work-from-home practices, has left office vacancies in San Francisco at around 35%, a record high. Brokers have described the situation as “brutal” and believe the city is experiencing “fundamental change.” But when it comes to the “Flight to Quality,” things appear less volatile. Gaps between classes are reaching historical levels, having peaked in Q1 2022 at 24.79% and experiencing a steady decline ever since. The gap currently sits at 22.01%, wider than Q1 2020. While the overall office market in San Francisco seems grim, the widening gap indicates that pricing may be stabilizing and that these higher-quality offices could retain value greater than their lower-quality counterparts.
Luring Workers Back to the Office in Los Angeles
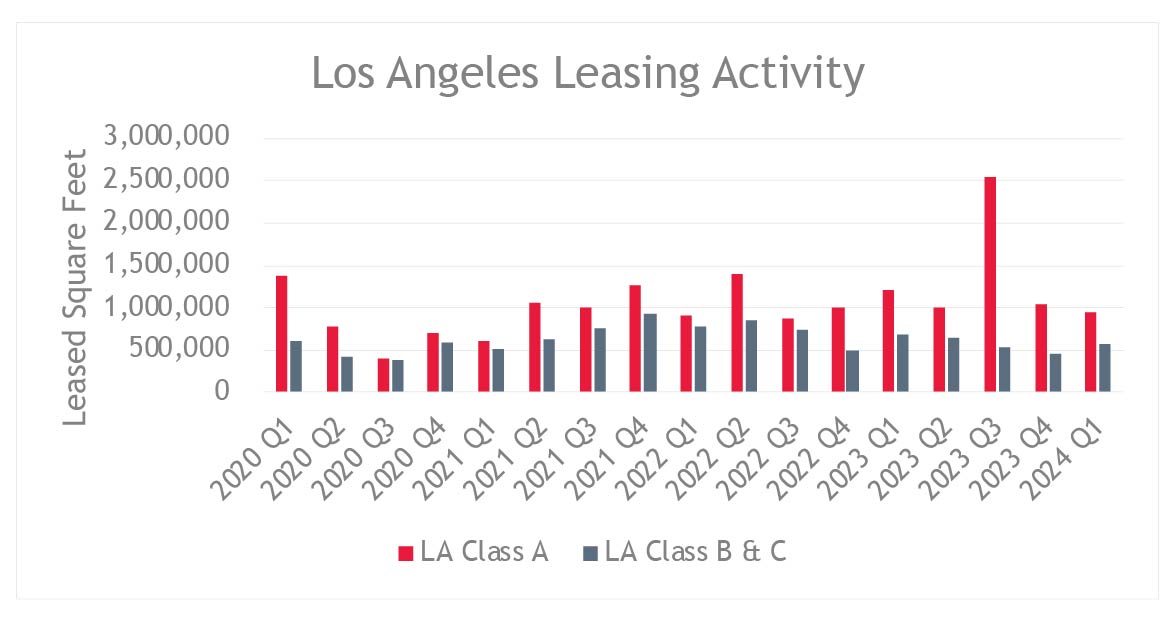
Los Angeles is experiencing high leasing activity in the Class A market, totaling 28.02 million leased square feet since Q1 2020. Like New York and Chicago, Los Angeles is experiencing the “Flight to Quality” phenomenon, but it appears to be more property-specific than market-wide. In Century City, for example, a talent and sports agency is expanding its footprint from 300,000 square feet to a 400,000 square foot pre-leased space at a trophy office set to finish construction in 2026.
Brokers have noted that Class A office products perform quite well in the Los Angeles market, specifically in West Los Angeles. Notably, submarkets like Century City and Culver City are experiencing a “Flight to Quality” trend that is expected to continue as companies seek more incentives for their employees to return to the office.
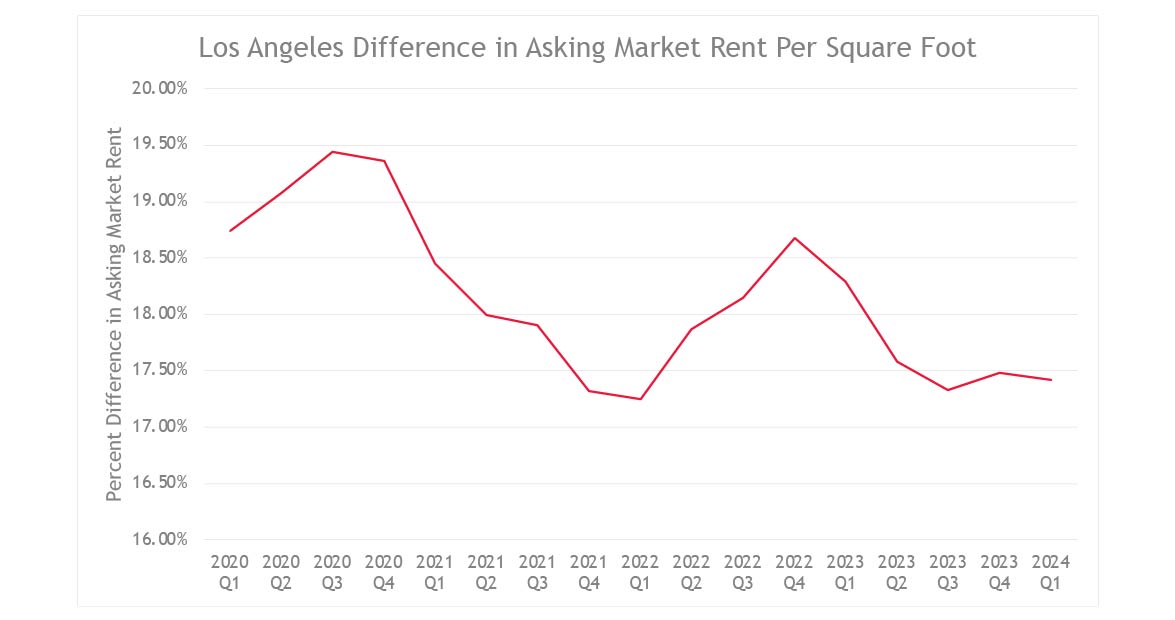
Another quirk that the LA market is experiencing is a volatile difference in asking market rents per square foot between Class A and Classes B and C office assets, peaking at a 19.44% difference in Q3 2020. The gap currently sits at 17.42%, one of the lowest gaps since Q1 2020.
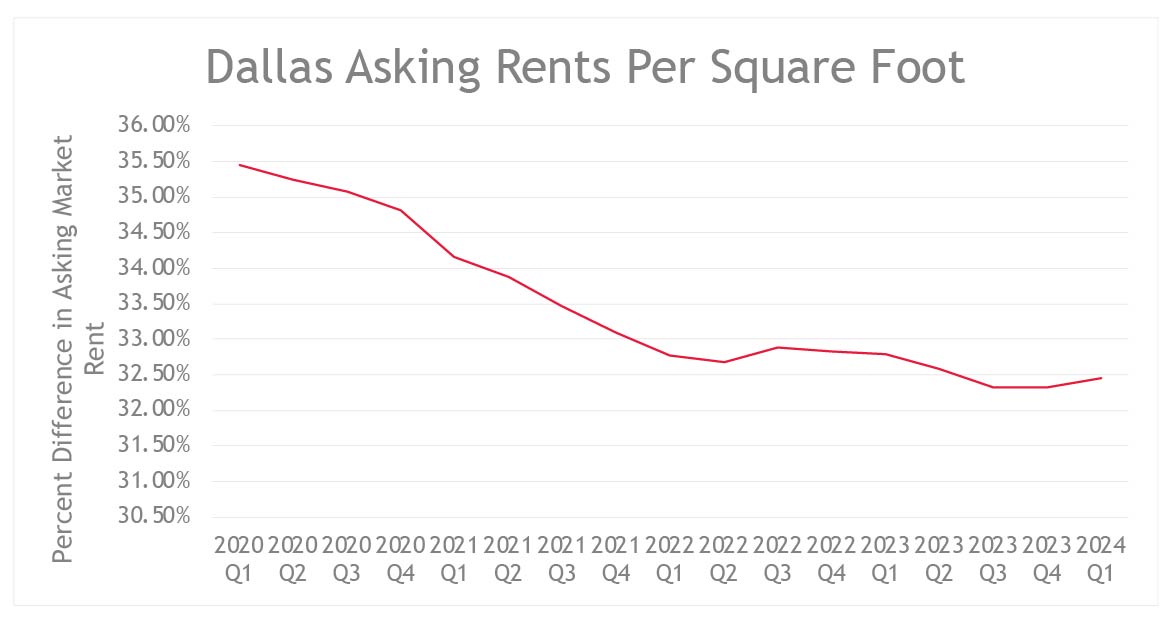
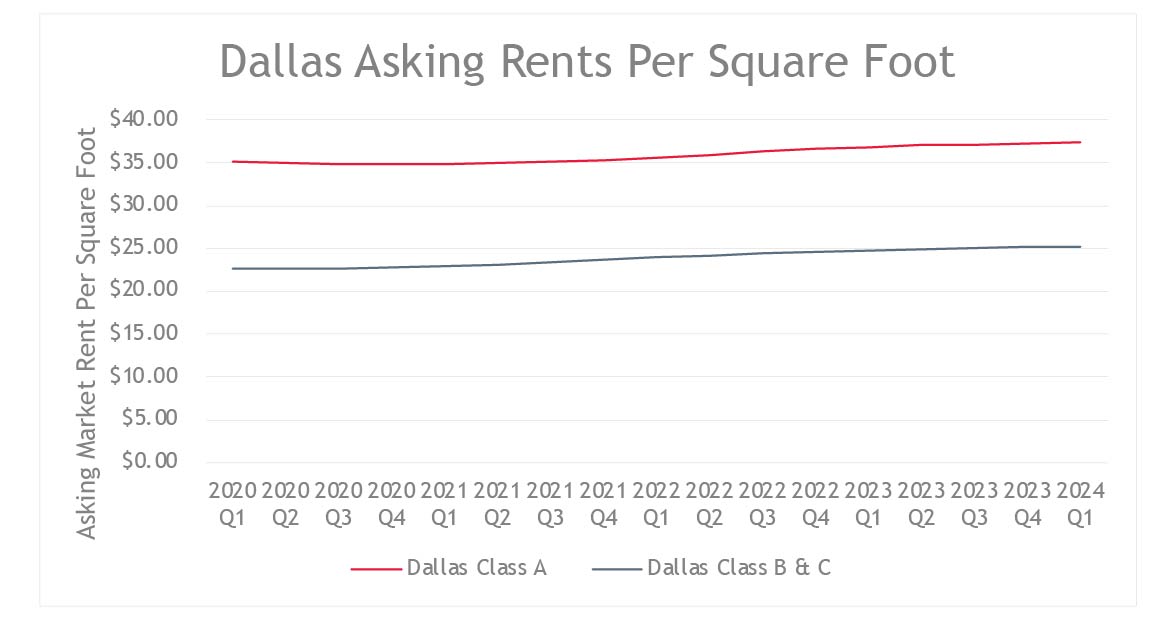
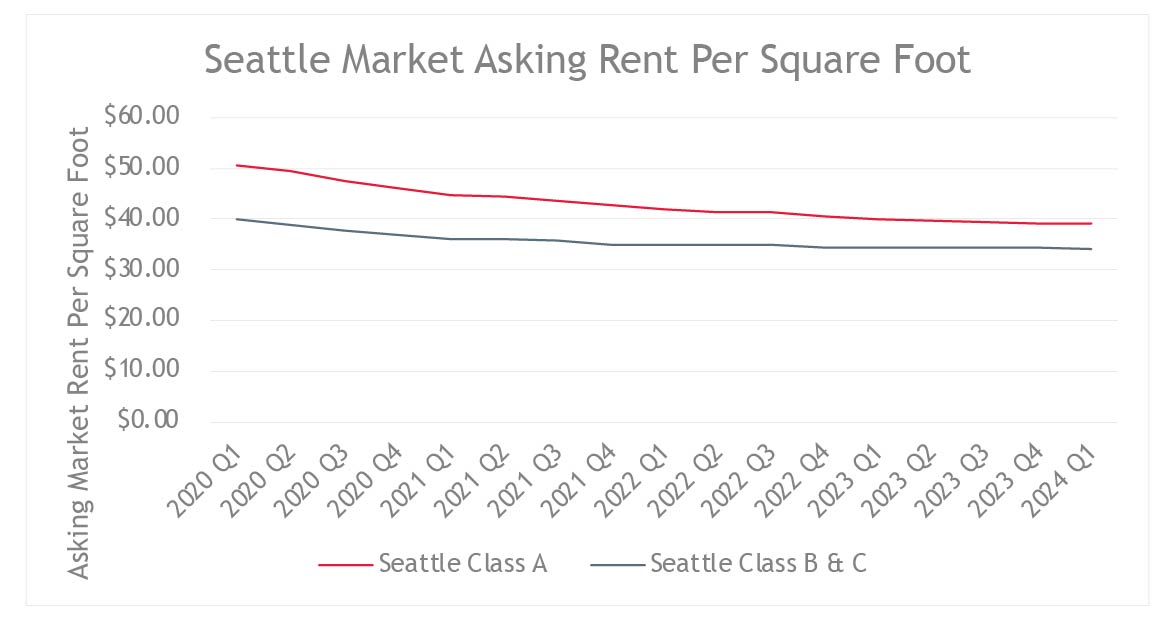
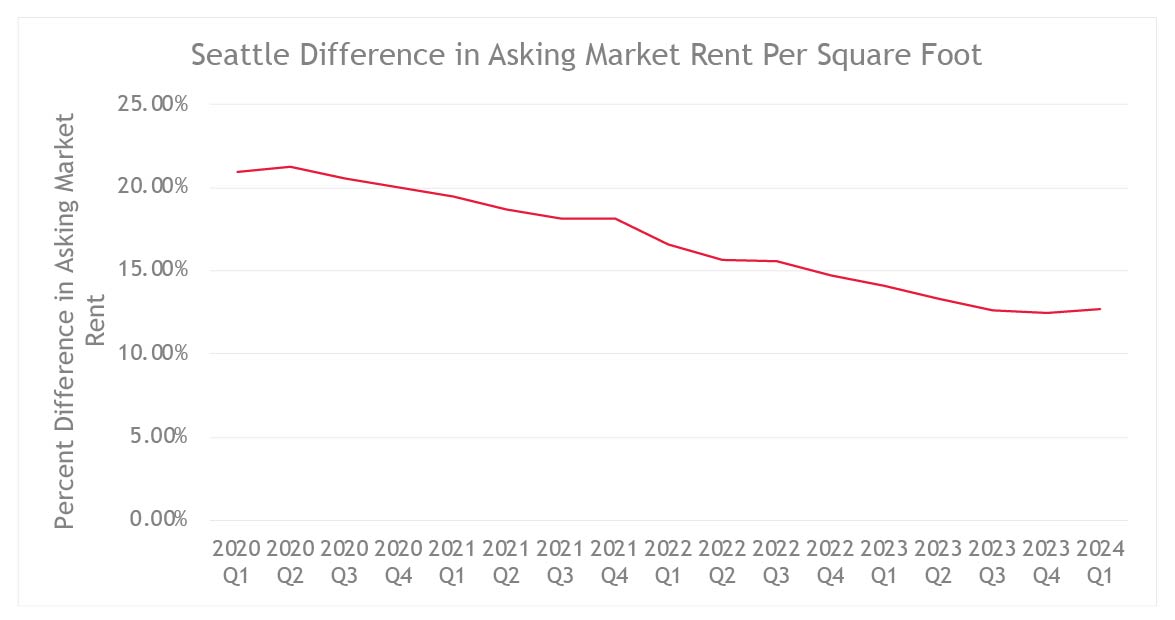
Conversely, Dallas and Seattle markets experienced steady declines in asking market rents over the same period. The asking market rent gap between Class A and Classes B and C assets is closing, with Dallas Class A rents increasing at a much slower pace than Classes B and C rents, and Class A rents in Seattle decreasing at a similarly slower pace when compared to Classes B and C rents.
As in Los Angeles, the Dallas and Seattle markets have seen an increase in leasing activity in Class A space indicating a “Flight to Quality,” with high Class A leasing activity from Q1 2021 to Q4 2023, exhibiting 52.22% and 47.29% more Class A leased space than Classes B and C, respectively.
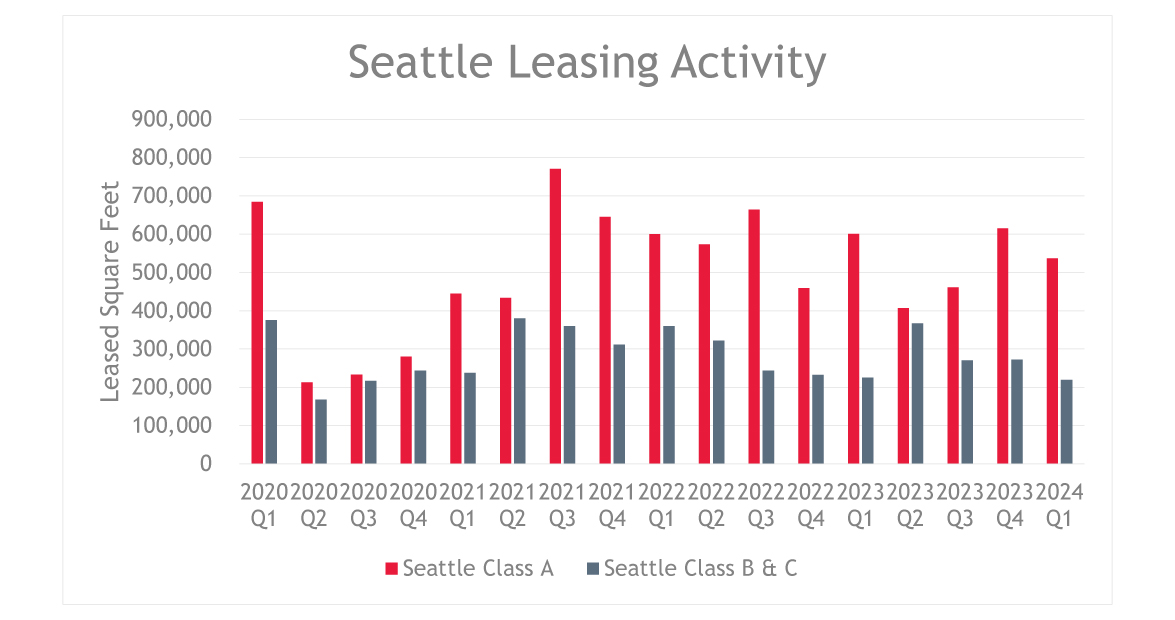
The data shows that the “Flight to Quality” trend has already peaked and is now occurring at a decelerated pace in these two cities. The Dallas market exhibits 6.29 million leased square feet of Class A office space in 2022, decreasing to 4.25 million in 2023, while the Seattle market exhibits 2.30 million leased square feet in 2022, decreasing to 2.08 million in 2023.
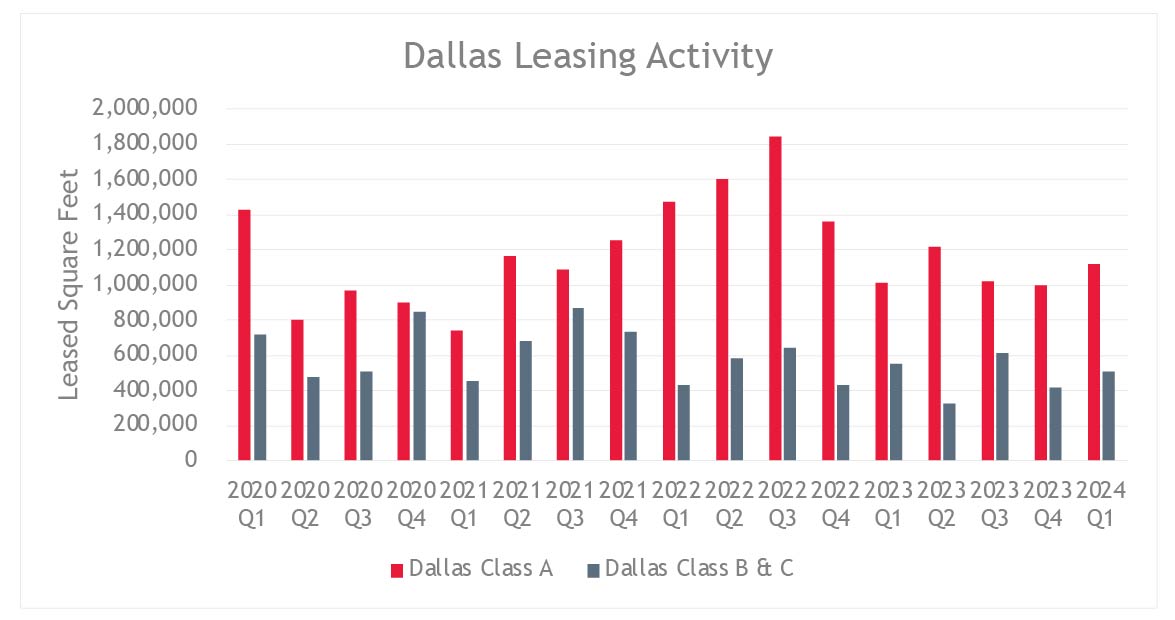
Overall, regional and local credit tenants continue to prefer well-located Class A and B properties with nearby or on-site amenities. In the Dallas market, the “Flight to Quality” trend has significantly influenced leasing activity in Class A trophy properties over the past three years. In the fourth quarter of 2023 alone, the market experienced a slowdown in negative absorption and an increase in leasing activity. That increase stabilized for Class A and B projects in the first quarter of 2024, although Class C assets continue to face challenges in attracting attention from the marketplace.
Evaluating Flight to Quality City-by-City
While market participants and the media may wish it were otherwise, the “Flight to Quality” phenomenon is not occurring consistently throughout the commercial real estate market nationwide. Rather, “Flight to Quality” seems to be taking place to varying degrees throughout the U.S., but not all assets appear to be equal. When evaluating these properties, it is imperative to look at the key drivers of value and tenant attraction on a city-by-city basis.
BDO’s VCMA professionals can help provide insights on the industry trends and the financial intelligence needed to make well-informed valuation and business decisions in today's market. To learn more contact us.
SHARE